UNEDITED & UNCORRECTED DRAFT - PLEASE DO NOT QUOTE
Asian Americans are the fastest growing racial grouping in the United States of America since 2010, by percentage rate of growth. According to the U.S. Census Bureau, the Asian American population in 2014 was estimated to be 20 million people, and by 2050, projected to be 40.6 million people.
In other words, the Asian American population will double in 36 years, but is the Asian American church ready? How can the American church be prepared for this explosive growth?
Before we jump ahead and come up with ideas for what we could do to respond, it’s important to take the time to understand the Asian American population for its history, its growth, its geography, its diversity, and its generations.
HISTORY
The term Asian Americans refers to Americans of Asian descent, based on the U.S. Census racial category of Asian, defined as “a person having origins in any of the original peoples of the Far East, Southeast Asia, or the Indian subcontinent including, for example, Cambodia, China, India, Japan, Korea, Malaysia, Pakistan, the Philippine Islands, Thailand, and Vietnam.” (This is one of five categories used in the U.S. Census: White, Black or African American, American Indian or Alaska Native, Asian, and Native Hawaiian or Other Pacific Islander.)
A census is taken by the U.S. government every 10 years to gather population data to inform its policies. In their own words, “Information on race is required for many Federal programs and is critical in making policy decisions, particularly for civil rights. States use these data to meet legislative redistricting principles. Race data also are used to promote equal employment opportunities and to assess racial disparities in health and environmental risks.” This categorization is made by self-identification of the person filling out the census questionnaire.
A government taking a census is not particularly unusual, as it was done in biblical times too, even around the time Jesus was born. As the Christmas story is retold every year, the passage in Luke 2 starts with a description of a census:
In those days a decree went out from Caesar Augustus that all the world should be registered. This was the first registration when Quirinius was governor of Syria. And all went to be registered, each to his own town. And Joseph also went up from Galilee, from the town of Nazareth, to Judea, to the city of David, which is called Bethlehem, because he was of the house and lineage of David, to be registered with Mary, his betrothed, who was with child.
However, what the U.S. government has done in its policy-making with Asian Americans has been tainted with discriminatory injustice. Three of the most notable ones were: the Chinese Exclusion Act in 1882 that prohibited the immigration of Chinese laborers until 1943, the Japanese American internment camps during World War II, and anti-miscegenation laws that banned interracial marriage existed until 1967.
Many Asian Americans also have a shared experience of discrimination on a personal and societal level, in addition to its past history of legislated discrimination. People make insensitive remarks about others based on how we look, how we talk, and what we eat. I still hear stories from American-born Asian Americans (even into the fifth generation) that they’re asked the question, “Where are you from?” and when they respond with California or New York, they’re asked again, “Where are you really from?” Or, “Oh, your English is so good!” Whether the racially-insensitive remarks are intentional or unintentional, they’re still hurtful and wrong.
Additionally, elements embedded into the psyche of American culture, undoubtedly influenced by history as well as media portrayal, reinforce the perception of Asian Americans as perpetual foreigners. Those marginalizing elements show up in politics too. While campaigning to become the U.S. President in Fall 2015, Republican candidate Donald Trump does a little impression using broken English to mock negotiators from Japan and China. This happened just a day after Florida governor Jeb Bush used a derogatory term “anchor babies” when referring to Asian mothers coming into the U.S. to take advantage of birthright citizenship.
The Asian American church is uniquely positioned to advocate for the social justice of the whole Asian American community, as an integral part of our Christian witness in the world as we proclaim the good news of the Gospel. Jesus described his work of social justice when he read from the Old Testament Scriptures (Isaiah 61:1-2) in Luke 4:18-19 —
“The Spirit of the Lord is upon me, because he has anointed me to proclaim good news to the poor. He has sent me to proclaim liberty to the captives and recovering of sight to the blind, to set at liberty those who are oppressed, to proclaim the year of the Lord’s favor.”
Social justice is also listed in the short list of three essential requirements God has for humankind, as it plainly states in Micah 6:8 — “He has told you, O man, what is good; and what does the Lord require of you but to do justice, and to love kindness, and to walk humbly with your God?”
Plus, the Christian church has a historical precedence for being actively fighting for social justice:
GROWTH
The Asian American population had grown most dramatically since 1965 due to the U.S. government’s changing its immigration policy. Pew Research Center’s Rise of Asian Americans explained it as follows:
Since 2010, Asian Americans ar the fastest growing racial group in the United States. In 2014, the Asian American population was estimated at 20 million. These large numbers are hard to imagine, so let’s look at 2 examples. The entire population of the entire state of New York is estimated at 20 million in 2014. That’s the same number of Asian Americans living in all 50 states!
How about a sports analogy? The seating capacity of Yankee Stadium is just under 50,000. A full season of major league baseball is 81 games at home. Take the total season’s attendance in a sold-out Yankee Stadium and multiply that 5. That would be 20 million people.
<insert updated chart here>
By 2050, the Asian American population is projected to exceed 40.6 million. Proportionally, Asian Americans currently make up about 5% of the US population, and that will almost double to 9% by 2050. On the whole, the American population is projected by 2042 to be multi-ethnically diverse with no racial majority.
How is the Asian American population growing faster than the other racial groups? Very simply, there are essentially 2 reasons for any population growth: reproduction (typically measured as the birth rate) and immigration. And this shared history of immigration is what a majority of Asian Americans have in common, with 74% of Asian Americans adults who are foreign-born.
Even as the economy in parts of Asia has dramatically improved in recent years, many Asians keep immigrating to America. Have you noticed where things are made and manufactured today? I’ve noticed over the past 5 or 10 years, it’s as if almost everything I have is made in China: the MacBook I’m typing this on, my cell phone, my clothes, my furniture, my dishes, bowls, and silverware, my shoes, and so on. Perhaps you’ve noticed this too. Who would have imagined that China-based Lenovo would buy out the personal computer business of all-American brand IBM. And you may recognize these global brands that originate from South Korea: Samsung, Kia, Hyundai, and LG. Not to mention the many global brands from Japan that have endured many decades, like Sony, Toyota, Honda, Canon, Nissan, and Panasonic.
This would suggest that economic opportunity is not the only reason for Asian immigration. There are actually many other reasons for making the dramatic change from one’s native country in Asia to immigrate to a vastly different country like the United States, including: family reunification, better educational opportunities, freedom & safety from political oppression, and yes, it could be said that even Asians pursue the American dream.
There’s another reason for population changes in a community that should be noted—and that is migration. The population of the United States is considered highly mobile and the Census Bureau collects data on the rate of migration, also known as “geographic mobility.” Between 2011 and 2012, 12% of Americans people moved at least once. This probably affects you and/or someone you know. One research found that the average American moves 11 times in a lifetime.
In other words, 1 in 8 Americans every year is moving from their current home to live somewhere else, whether moving within their city or county, or moving to another part of the state or a different state altogether. When and where people move has a significant impact on the local demographics and economies of the places where they moved from and where they now live.
And this geographic mobility of Asian Americans, whether internationally or domestically, can have a significant impact on the local church too. Two things to note here. First, Asians in America are much more receptive to Christianity than their home country in Asia. The next chapter will take a closer look at the statistics that illustrate this.
Secondly, people in general are the more receptive when they have relocated, whether to a new country or to a new community. New people moving into your church’s community is a tremendous ministry opportunity for churches to be strategic and intentional in having ministries that welcome newcomers by providing assistance for practical needs of relocating. It’s fairly common for ethnic Asian churches to provide assistance with language translation, English classes, Asian language classes, and other related social services.
Now let’s take a look at where Asian Americans live.
GEOGRAPHY
This chart below illustrates the proportions of where Asian Americans live in four U.S. regions.
<insert chart here>
The largest percentage of Asian Americans (47%) live in the western U.S. states, with the highest concentration in California and Hawaii. But that also means that 53% of Asian Americans live outside of the West, with 11% in the Midwest, 20% in the Northeast, and 21% in the South. When considering where Asian Americans live in order to ministry, do not focus only on the West Coast but see the entire dispersion of the Asian American population.
In each of the U.S. states, English is the most spoken language and Spanish is the second most spoken in almost all states. But notice how many states have an Asian language as the third most spoken language, as illustrated in this chart of most commonly spoken languages in these (from Tagalog in California, Cherokee in Arkansas: What language does your state speak? by Ben Blatt, in Slate, May 2014):
<insert Slate chart here>
Did you know that Vietnamese is the third most spoken language in Washington, Texas, Oklahoma, and Nebraska? And, Korean is the third most spoken language in Georgia and Virginia? See the large Chinese-speaking population in New York? There’s a large Hmong-speaking population in Minnesota. And, there are large populations of Tagalog-speaking Filipinos in California, Nevada, and Hawaii.
What does all of this mean? Here’s a couple of thoughts. If a ministry opportunity to Asian Americans doesn’t open up in California or one of the other western states, there are many other Asian Americans elsewhere in other states.
And, while these demographics have shown the broader distribution of the Asian American population, nationally, regionally, and state-by-state, there are very distinct demographics at a local level. You’ll want to research the Asian American demographics for your specific location, whether that’s for the city, the county, or the metropolitan area. Here’s 3 great resources for finding local demographics:
- U.S. Census’ QuickFacts census.gov/quickfacts
- FactFinder.Census.gov provides census data by state, county, city, or zip code
- city-data.com has aggregated detailed profiles of all cities in the United States
DIVERSITY
Asian Americans are not all alike. Far from it. The many varieties of Asian Americans consist of more than 34 ethnicities, each with vastly different backgrounds of languages, cultures, nationalities, history of immigration, and more. These differences and distinctives are often lost when Asian Americans are grouped together.
For instance, the U.S. Census only specifies these 11 Asian ethnicities by name: Asian Indian, Chinese, Filipino, Japanese, Korean, Vietnamese, Hmong, Laotian, Thai, Pakistani, and Cambodian. And then the “Other Asian” category in the Census would include the likes of: Taiwanese, Bangladeshi, Burmese, Indonesian, Nepalese, Sri Lankan, Malaysian, Bhutanese, Mongolian, Okinawan, Tibetan, Mien, Singaporean, Tamil.
Proportionally, 6 Asian ethnicities comprise 83% of Asian American population: Chinese, Filipino, Asian Indian, Vietnamese, Korean, Japanese. When the Pew Research Center’s report, Rise of Asian Americans, was first published in 2012, it presented statistics on the top 6 Asian American ethnicities that tended to obscure the distinct differences of the other Asian American minorities. The 2013 updated edition provided additional data on 14 smaller Asian ethnicities, with more detailed economic and demographic data for 9 of these groups.
When statistics are presented about Asian Americans, be careful not to use the overall general statistics to describe the whole. 17% of the Asian American population consists of many more smaller ethnicities with very different socioeconomic issues and, therefore, different ministry opportunities requiring fine-tuned contextualized strategies.
Why is this important? For one, a majority of Asian Americans do not self-identify as Asian Americans. How this preference is described: “… the “Asian American” label has not been embraced by any group of U.S. Asians, be they native born or foreign born. Most describe themselves by their country of origin, such as “Chinese American,” “Filipino American” or “Indian American,” rather than by a pan-Asian label. Overall, just one-in-five (19%) say they most often describe themselves as Asian or Asian American and even fewer (14%) say they describe themselves as just plain American.”
Secondly, to ignore the distinctive cultural differences of this very diverse Asian American population may be racially insensitive or worse, offensive. These racial insensitivities and offenses occur in pop culture like when a fictional character is portrayed with a bad “Asian” accent that is nothing more than mixed-up gibberish. And sadly, insensitive incidents have occurred in American Christianity also. The thing is, unintentional words are just as painful and hurtful in its impact as intentional offenses. Rather than asking the offended why they’re being so sensitive, ask why the offender is being so insensitive.
Thirdly, overgeneralization has perpetuated the “model minority” myth, where statistical achievements by some Asian Americans have overshadowed the serious social and economic needs of other Asian Americans. A statement like this, “Asian Americans are the highest-income, best-educated and fastest-growing racial group in the United States” can be mistakenly used to shape policies in governments and ministries in churches that leave the needy in need and the hurting in hurts.
While a sizeable number of Asian Americans have achieved much educationally and financially, there are also significant numbers of Asian Americans are disadvantaged and struggling, especially among Southeast Asians and smaller Asian American groups.
Yes, on the whole, Asian Americans are more educated and have higher median family income than any other racial groups. 49% of Asian Americans have a college degree (or several), compared with 28% for the U.S. population. The educational level of recent Asian immigrants is even higher, with 61% having a college degree. Asian Americans have the highest median household income at $66,000, compared with $49,800 for all Americans.
Asians recently passed Hispanics as the largest group of new immigrants to the United States.
But that is not the whole picture. Here are a few data points for reference from Asian-Nation’s “The Model Minority Image“:
- Only 20% of Vietnamese Americans have a college degree
- Less than 10% of Laotians, Cambodians, and Hmong have a college degree
- Almost 40% of all Vietnamese refugees are on public assistance in California
- 40% of Cambodians, Hmong, and Laotians receive public assistance in Minnesota and Wisconsin
And, from the UCLA Asian American Studies Center: 2015 Statistical Portrait of Asian Americans, Native Hawaiians, and Other Pacific Islanders:
- 12.7% of the Asian alone population live in poverty
- 14.6% of the Asian alone population do not have health insurance coverage
On the other hand, to have a broader understanding of the Asian American population, it may be helpful to aggregate these many ethnicities into 3 sub-groups for their notable similarities: East Asians, Southeast Asians, and South Asians.
East Asians come from China, Korea, Japan, Taiwan, and Mongolia. Confucianism has deeply influenced East Asian culture and political life. The desire to have a son, respect for one’s parents, respect for the elderly and respect for teachers represent a few of the concepts that arise from Confucian teachings. Confucianism is built on the important hierarchy of five relationships for a harmonious society: ruler to subject, father to son, husband to wife, older brother to younger brother, and older friend to younger friend.
Southeast Asians are from Vietnam, Thailand, Laos, Cambodia, and Vietnam, Myanmar, Malaysia, Singapore, Indonesia, the Philippines, and Brunei. These countries have varying degrees of Western influence, like the French in Vietnam and the Spanish in the Philippines. China has had strong influence in Singapore and Malaysia.
South Asians are from India, Pakistan, Bangladesh, Bhutan, the Maldives, Nepal, and Sri Lanka, countries that have been influenced as British colonies. Desi is a term that describes the people and cultures of the Indian subcontinent. Desi is known for its music and dance, as well as its foods and spices.
BY THE NUMBERS
Let’s drill down to the population numbers (from 2010) for each of the Asian American ethnicities:
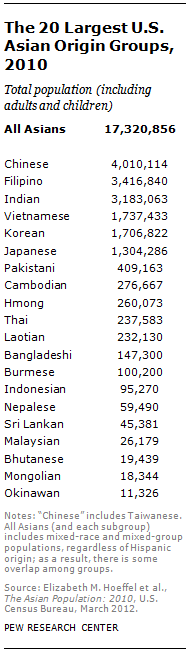
To learn more about each of these Asian American groups, please refer to Section II of the Rise of Asian Americans report, titled “Characteristics of Major Asian-American Subgroups,” for an excellent description of each of the top 6 Asian American groups (Chinese, Filipino, Indian, Vietnamese, Korean, Japanese) with a history of the group’s immigration narrative and its characteristics: nativity and citizenship, language, age, marital status, fertility, educational attainment, income, home ownership, poverty status, regional dispersion, and attitudes on life in America.
And in Section V of the report’s additional tables, titled “Characteristics of Smaller U.S. Asian Subgroups, 2010”, you’ll find data for 9 Asian American groups (Pakistani, Cambodian, Hmong, Thai, Laotian, Bangladeshi, Indonesian, Sri Lankan, Malaysian) with the economic and demographic characteristics of adults.
With so many Asian Americans from different countries and influences, each ethnicity has also different religious influences and varying exposure to Christianity. The next chapter will take a look at the faiths and religions of Asian Americans.
UNEDITED & UNCORRECTED DRAFT - PLEASE DO NOT QUOTE
While making a strong case for the need for awareness of the differences among the different Asian ethnicities and people groups, the information does seem to weight more on the side of the higher represented groups with additional color and depth given there whereas the lesser represented groups tend to have their information more general or glossed over. An example would be the last three paragraphs of the Diversity section.
Consider also improving the analogies for the 20M size of the Asian-American population, the Yankee Stadium analogy seems like a stretch and is not as accessible to readers. The NY state example seems to be a good one.
The third language map was also an eye opener.
Also, while each section makes good points, they seem a bit disconnected. It would be great it each section weren’t just descriptive but perhaps integrated in a way that makes it flow better. For example how did the history play into current day demographics? In one paragraph there is a question, what does this al mean? Highlight that in each section and then also in a summary to help drive home the main points to the reader.
excellent comments and helpful input, thank you Eric! will try to catch ’em all
Good into DJ. my contention tho is data should lead to analytics and analytics to insight and action. looking forward to next chapter